프로그래밍/Chart JS
chart.js 크기 조정 / 사이즈 조정
밍구몬
2019. 7. 25. 14:38
chart.js 샘플을 가져와 실행시켜보면 엄청 크다 ...
그래서 chart의 크기를 변경하는 방법을 찾아보았다.
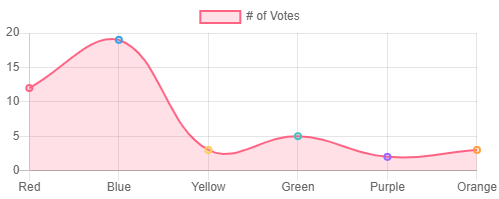
1. chart.js 정적 크기
우선 chart를 그려줄 canvas태그를 넣어주고 원하는 높이와 넓이를 설정해 준다.
<canvas id="myChart" width="500" height="200"></canvas>그 다음 차트 옵션에 responsive: false 를 추가시켜 준다.
<script>
	var ctx = document.getElementById('myChart');
	var myChart = new Chart(ctx, {
		type: 'line',
		data: {
			labels: ['Red', 'Blue', 'Yellow', 'Green', 'Purple', 'Orange'],
			datasets: [{
				label: '# of Votes',
				data: [12, 19, 3, 5, 2, 3],
				backgroundColor: [
					'rgba(255, 99, 132, 0.2)',
					'rgba(54, 162, 235, 0.2)',
					'rgba(255, 206, 86, 0.2)',
					'rgba(75, 192, 192, 0.2)',
					'rgba(153, 102, 255, 0.2)',
					'rgba(255, 159, 64, 0.2)'
				],
				borderColor: [
					'rgba(255, 99, 132, 1)',
					'rgba(54, 162, 235, 1)',
					'rgba(255, 206, 86, 1)',
					'rgba(75, 192, 192, 1)',
					'rgba(153, 102, 255, 1)',
					'rgba(255, 159, 64, 1)'
				],
				borderWidth: 2
			}]
		},
		options: {
			responsive: false,
			scales: {
				yAxes: [{
					ticks: {
						beginAtZero: true
					}
				}]
			},
		}
	});
</script>
responsive는 디폴트로 true로 되어있기 때문에 false로 변경하여 주면 원하는 크기의 chart를 만들어 줄 수 있다.
2. chart.js 동적 크기
chart를 반응형으로 만들고 싶다면 reponsive는 false로 두고 canvas를 수정해 주면 된다.
<canvas id="myChart" style="height:30vh; width:50vw"></canvas>vh vw를 이용하여 반응형으로 만들어 주었다. vh vw를 이용하여 퍼센트처럼 사용할 수 있다.
<!DOCTYPE html>
<html>
<head>
<meta charset="UTF-8">
<title>chart.js</title>
<head>
	<script type="text/javascript" src="https://cdnjs.cloudflare.com/ajax/libs/Chart.js/2.8.0/Chart.bundle.min.js"></script>
	<script type="text/javascript" src="https://cdnjs.cloudflare.com/ajax/libs/Chart.js/2.8.0/Chart.min.js"></script>
</head>
<body>
	<canvas id="myChart" style="height:30vh; width:50vw"></canvas>

  <script>
      var ctx = document.getElementById('myChart');
      var myChart = new Chart(ctx, {
          type: 'line',
          data: {
              labels: ['Red', 'Blue', 'Yellow', 'Green', 'Purple', 'Orange'],
              datasets: [{
                  label: '# of Votes',
                  data: [12, 19, 3, 5, 2, 3],
                  backgroundColor: [
                      'rgba(255, 99, 132, 0.2)',
                      'rgba(54, 162, 235, 0.2)',
                      'rgba(255, 206, 86, 0.2)',
                      'rgba(75, 192, 192, 0.2)',
                      'rgba(153, 102, 255, 0.2)',
                      'rgba(255, 159, 64, 0.2)'
                  ],
                  borderColor: [
                      'rgba(255, 99, 132, 1)',
                      'rgba(54, 162, 235, 1)',
                      'rgba(255, 206, 86, 1)',
                      'rgba(75, 192, 192, 1)',
                      'rgba(153, 102, 255, 1)',
                      'rgba(255, 159, 64, 1)'
                  ],
                  borderWidth: 2
              }]
          },
          options: {
              responsive: false,
              scales: {
                  yAxes: [{
                      ticks: {
                          beginAtZero: true
                      }
                  }]
              },
          }
      });
  </script>
</body>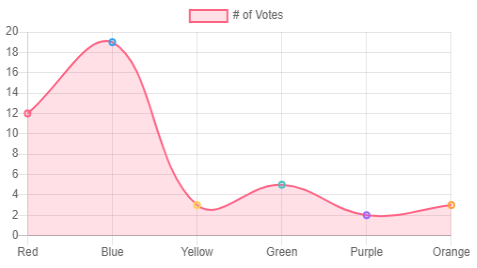
위 처럼 reponsive옵션을 false로 바꾸는 방법도 있고, div로 감싸고 옵션에서 maintainAspectRatio를 false로 바꾸는 방법도 있다.
<div class="chart-container" style="position: relative; height:200px; width:40vw">
	<canvas id="myChart"></canvas>
</div>
options: {
maintainAspectRatio: false,
}